


It's been a couple of weeks since I joined my team and hitting the ground running was one of my major concerns in a remote setup. A lot of factors have been at play to result in productivity from the word go, but today I'll be highlighting one area ...debugging 🔍 .
Here's a brief overview of some of the techniques I have found really helpful.
Logging
This is simply recording events happening in your application. Logs can vary from writing stack traces to a file to printing values in the terminal.
In the Android world, you might already be familiar with the Log class that ships with the Android SDK and various logging levels that it offers. If you aren't here are a few snippets.
Log.i("Class Name or sth","$value")
Log.d(TAG,"$value")
There are also libraries that have been built on the Log class such as timber to provide some level of convenience.
In Java/Kotlin modules, since the Log class isn't accessible, I use the Logger class from the java utils package. A snippet of using this would look almost similar to androids logging.
private val logger = Logger.getLogger(TAG)
logger.log(Level.INFO,"$value")
There are also some convenience libraries for this if you don't want to use the default one, checkout Logback and SLF4J
As for production-level logging well that's a blog for another day 🙂.
IDE Debugger
Next is the IDE, Integrated Development Environment, debugger. In my day to day work as well as side projects, I use Jetbrains IDEs.
To get started and make use of the debugger
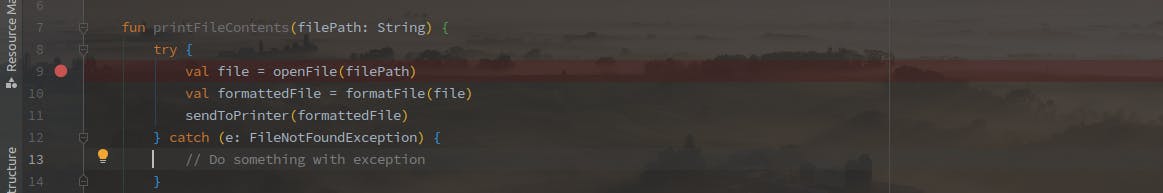
- Set a breakpoint by clicking on the IDE gutter on the code you want to examine. Code execution will be halted upon reaching the breakpoint.
- You'll need to run the app in debug mode as opposed to the normal run. To do this click on the debug icon
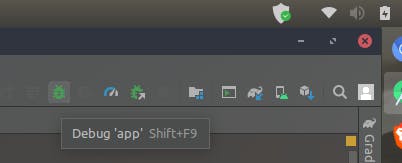
or if the application is running you could simply attach the debugger
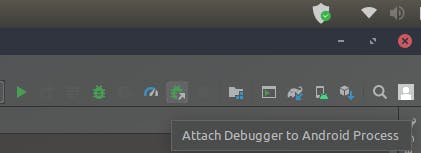
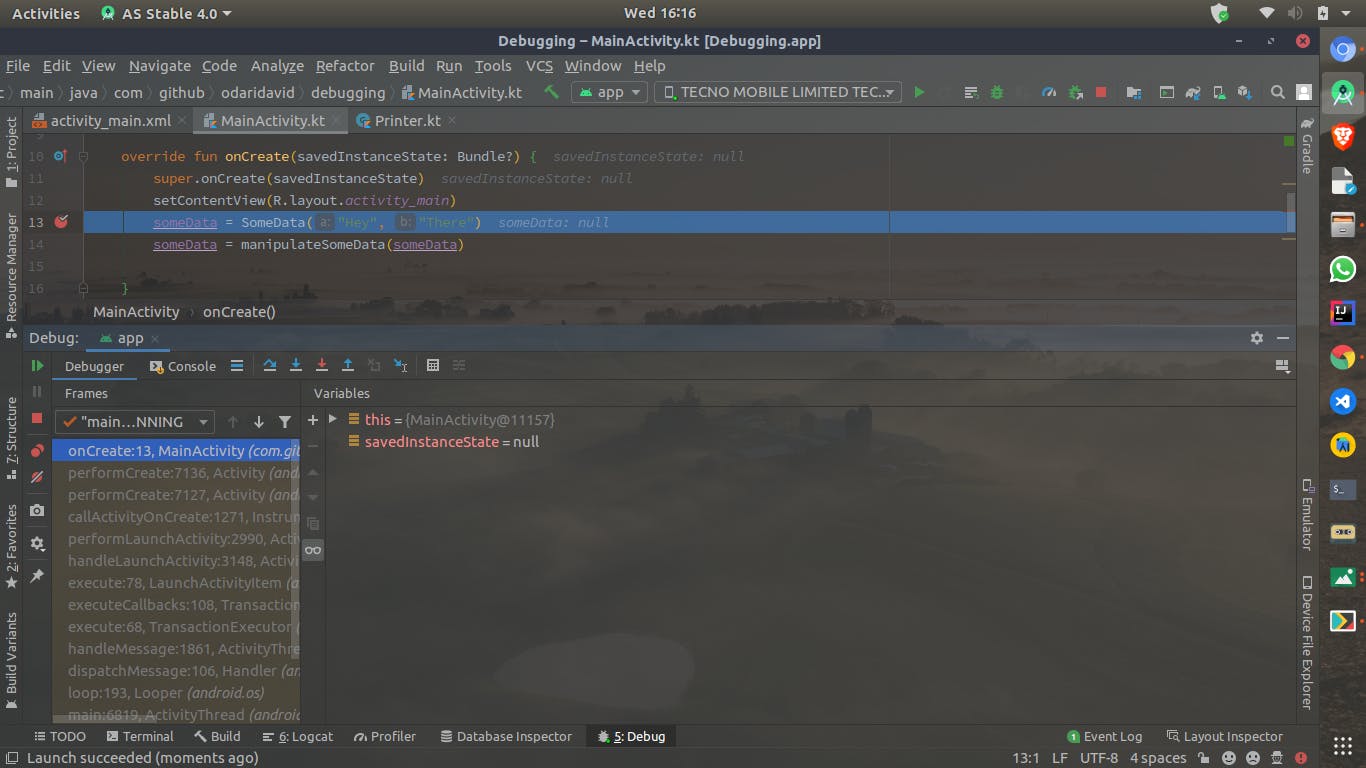
Once the app is running the debug window will pop up and you can begin your debugging 👻
As you can see code execution stops where the breakpoint was placed. To continue with code execution you can use the debugger steppers to move to the next line of code, skip a block of code or step out from a block of code.
| Step Over | Step In | Step Out |
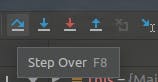 | 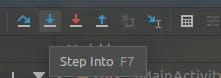 | 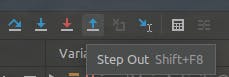 |
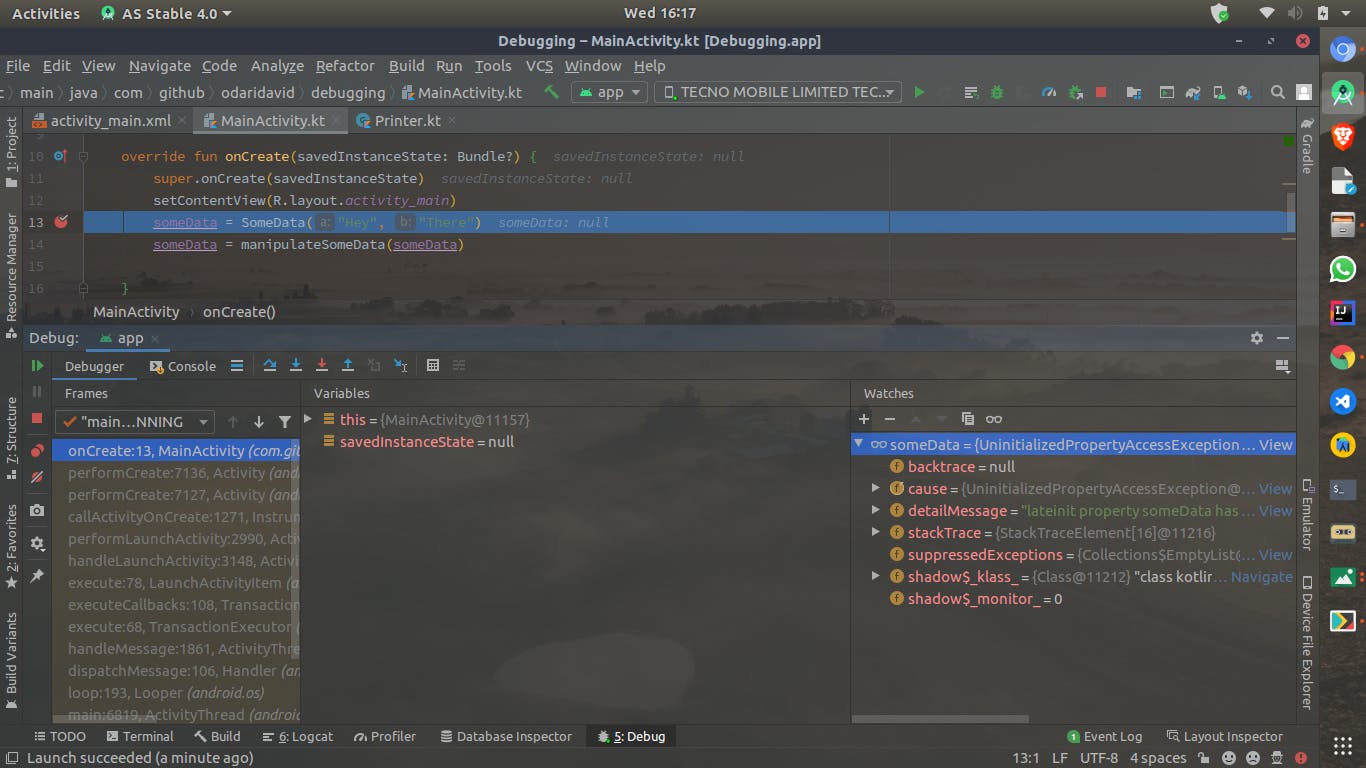
You'll notice variables values changing in the variables tab, but if you are interested in specific values you could make use of watches. If you can't see the watches tab, click on the grid on the top right of the debug tab and enable watches.
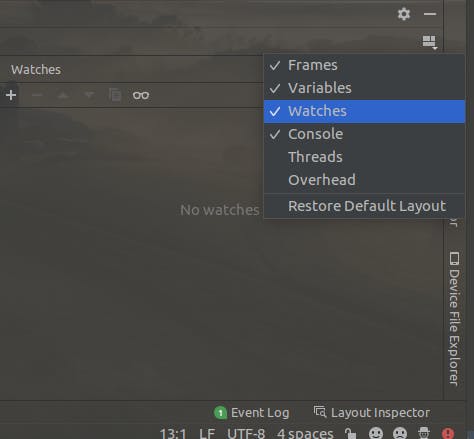
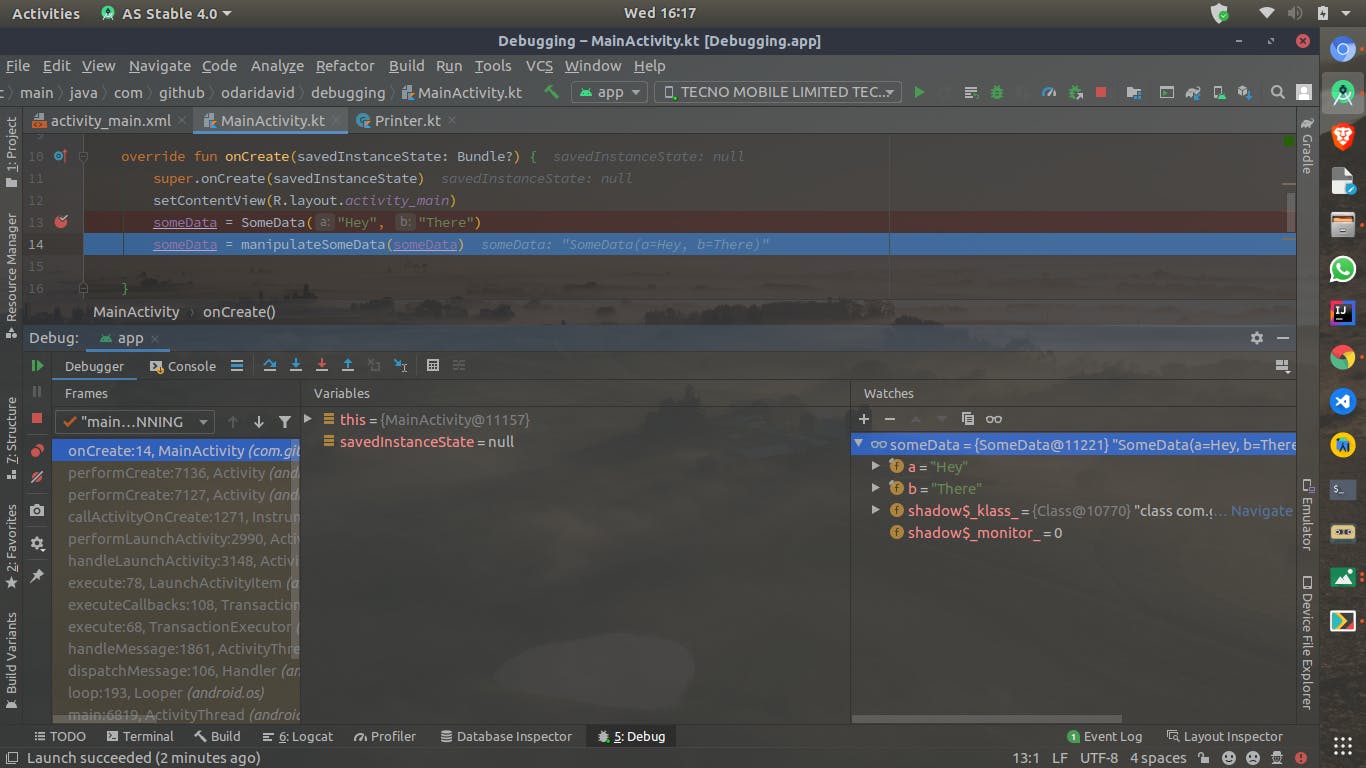
Click on the watches + button to add a variable to watch, a dropdown list will also pop up with variables that can be observed. As you move through your code with the steppers mentioned above you will see the value of the watched variable change.
Example;
Watching the someData variable before and after initialization
Before initialization
After Initialization
With this technique, I tend to use the Log class less and less.
IDE Shortcuts
If you are using a JetBrains IDEs, here are some handy shortcuts I use hourly if not daily while debugging.
Ctrl+B= Jump to code definitionDouble Shift= Perform search in projectCtrl+Q= Quick code documentation lookupCtrl+P= Lookup class or function parametersCtrl + Shift + -= Fold classes or functionsCtrl + Shift + += Unfold classes or functions- Find usages of variables,ids,classes etc from context menu.
For Mac users replace Ctrl with Command.
Layout Inspector
The layout inspector on Android Studio is really handy if you need to figure out what's happening with your layouts. It breaks down the hierarchy of views in your layout including those of any third party libraries you are using.
Navigating through files
While working on a large project navigating through files while debugging can be quite a hassle. To make this experience a bit more pleasant I believe the following factors should be worked on, that way even new developers joining the team will have an easier time.
- The naming of variables, files, modules, functions etc should reflect their purpose. Otherwise, have it documented or commented if it's not possible to have a clear name.
- Have some form of architecture, that way it will be easier to know what goes where and in the long run you can always pinpoint to where you think the issue is coming from.
Web Debugging Proxy
A web debugging proxy helps you debug by letting you inspect your HTTP/HTTPS traffic between your device and the internet. This enables you to see outgoing requests and incoming responses as well as the request headers.
Some cool tools that enable you to do that e.g Charles,Fiddler,Proxyman
Pair Programming
Having different perspectives towards solving a problem helps clear backlog and also if you are just joining the team it will accelerate your knowledge of the codebase and business needs, Also if you happen to be working remotely its a good avenue to check in with your team. 😊
Unit Tests
This is usually a hot topic among developers, but personally, tests have helped me avoid shooting myself in the foot lots of times and it's one of the ways I know my changes haven't screwed up anything. 😄
Documentation
Going through documentation is helpful and will save you lots of time if it's done well. This spans from external tooling, libraries and SDK documentation to internal processes and tooling documentation.
Divide and Conquer
If possible I isolate the affected area of code in a new project and try reproducing it.
And that is all I have for you now.
If you have any other ways in which you go about debugging your android apps drop them down in the comment section or reach out to me on twitter.
Thank you, till next time 🥂.